| One Reading A Day for One Month |
Link for Two Readings A Day for One
Month
Link for Three Readings A Day for One Month
Addendum: Track Blood Glucose (Sugar) and Pain Levels.
See
the instructions below to record and automatically graph your
own blood pressure, pulse rate (heart rate), pulse pressure,
body temperature, and respiratory rate (breathing rate), plus download your own
Vital Signs Tracker Form and the example.
(Also see the notes below for a link to
the original Legacy Version 1.0
website and using OpenOffice.org
spreadsheet "Calc.")
Download Vital Signs Tracker Form For Your Own Data Entry
Just download the Data Entry form from the link above. Then enter your data at the default "Data Sheet" tab. Then click on the tabs at the bottom to show the automatic graphs. (The instructions below are the details, in case you want to explore the options further.)
Downloads are free for personal use but may not be sold.*
This version includes cumulative, summary statistics (average, standard deviation, highest, and lowest values) for measurements of Vital Signs as suggested by Jack Hargraves in New Zealand. These statistics are presented just under your data on the Data Sheet.
This version retains graphs for body temperature as suggested by Leah Biondo in Melbourne, Australia. Graphs for respiratory rates have also been added, so that now graphs are available for tracking all the "Vital Signs," in addition to the original blood pressure graphs of earlier versions. See below for basic definitions of the "Vital Signs."
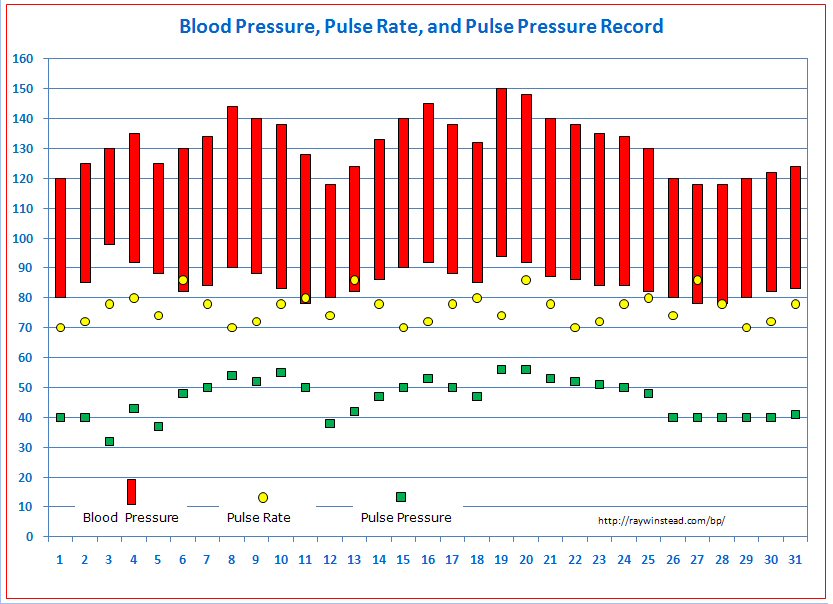
This version retains the earlier option to either include or omit the display/printing of the pulse rate and/or pulse pressure data from the main graph displaying blood pressure and pulse rate. This is especially useful when the pulse rates and pulse pressures overlap. They can then be displayed/printed separately with the blood pressure readings.
This version retains some additions and changes in earlier versions based on suggestions and comments by Laura Renfree from London, England; Michael Robichaud from Montreal, Canada; Margaret Dangoor from Richmond-upon-Thames, England; Neal Snitow; Ron Langbeckert from Astoria, Oregon, and Ed Winstead from Brevard, North Carolina. I thank them for their contributions.
Instructions for entering and displaying your own blood pressure, pulse rate (heart rate), body temperature, and respiratory rate (breathing rate) tracking data:
1. Download and save the Vital Signs Tracker Form from the link above. The Vital Signs Tracker Form will open in "Protected View," so you will need to click the button "Enable Editing" to enter your own data. (You are also encouraged to download the example.)
2. Open the saved file in Microsoft Excel. (These files are in 2012 Micosoft Office 365 Excel .xlsx format. However, earlier versions of Excel can read these files but MAY require a conversion addon available from Microsoft. See HERE.)
3. After taking your blood pressure, fill in the Systolic Pressure and Diastolic Pressure values into the appropriate columns in the "Data Sheet." Also enter your pulse rate (heart rate), body temperature, and respiratory rate into the appropriate columns. (Missing or unwanted data points can just be left out.)
4. The associated graphs will automatically update themselves with the new data points. The graphs will automatically adjust their scales based on the new data points, if necessary. Record Body Temperature in EITHER degrees Fahrenheit OR degrees Celsius to the nearest tenth of a degree, and the appropriate scale will be displayed. Just be consistent.
5. Display a graph by clicking on a tab at the bottom of the data entry page. Graphs available are "BP, PR, PP in Color," "BP, PR, PP in Black and White," "Body Temperature," "Respiratory Rate," "Running AVG BP, PR, PP in Color," "Running AVG BP, PR, PP in BW," "Extras in Color,", and "Extras in BW." (See below for "Extras" explanation.) You may return to the data entry page by clicking on the "Data Sheet" tab at the bottom left of a page with a graph. (If the "Data Sheet" Tab or some other tab is covered up, you may need to use the arrows at the bottom left of each screen to view the tabs.)
6. Save the file with a different name, e.g., bp-yourname-date.
7. To change a graph title, e.g., to Blood Pressure, Pulse Rate, and Pulse Pressure Record - YOURNAME - Month and Year: Click once on the title to select the title, then click again on the title to be able to edit the title. Edit the title and save. (The title may be moved before or after editing by clicking and dragging the title text box.)
8. The data set and graphs may also be printed. Color charts as well as black and white charts of the data are provided for some graphs to account for the capabilities of different printers. Individual graphs may be printed, or the entire Excel Workbook of all graphs and data may be printed at one time to take to a physician.
9. This version includes the option to either include or omit the display/printing of the pulse rate and/or pulse pressure data from the "BP, PR, PP Graphs." This is especially useful when the pulse rates and pulse pressures overlap. They can then be displayed/printed separately with the blood pressure readings. The following instructions are on the "Data Sheet."
"In addition to Blood Pressure, the
display and printing of Pulse Rate on the BP, PR, PP Graphs are the default settings.
However,
for not displaying or printing Pulse Rate click on the default "Yes" below and
change the "Yes" to "No" in the drop-down list that will appear."
"In addition to Blood Pressure, the
display and printing of Pulse Pressure on the BP, PR, PP Graphs are the default
settings. However,
for not displaying or printing Pulse Pressure click on the default "Yes" below
and change the "Yes" below to "No" in the drop-down list that will appear."
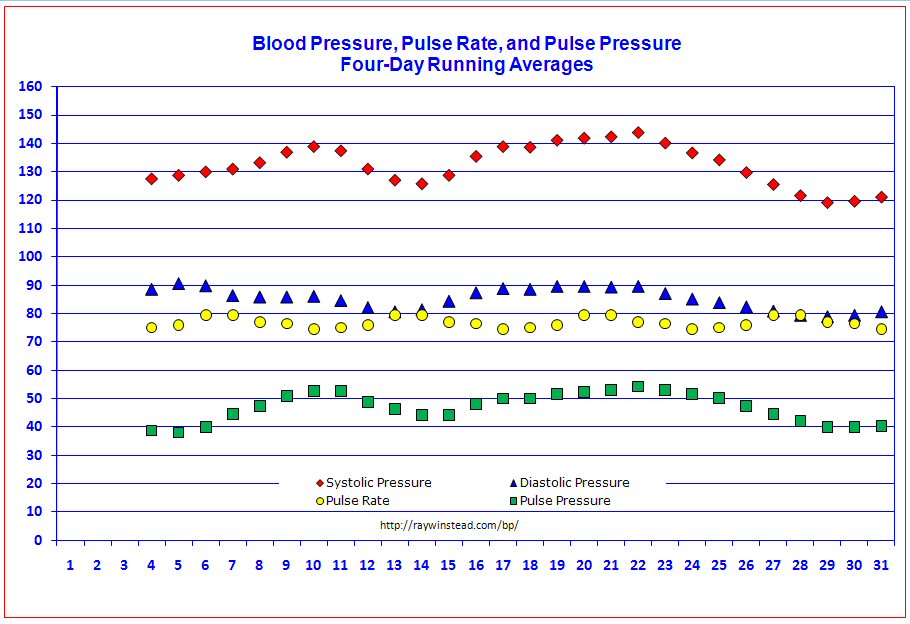
10. Note that graphs of Four-Day Running Averages for Blood Pressure values, Pulse Rate values, and Pulse Pressure values are also provided (for the files for one reading a day and two readings a day, but not for three readings a day). OPTIONAL : If you wish, you may continue the 4-day running averages using the data at the end of the preceding month at the beginning of the current month by recording the LAST THREE READINGS from the PRECEDING month at the BOTTOM of the "Data Sheet." The continuing 4-day running averages will be included at the beginning of the current month automatically.
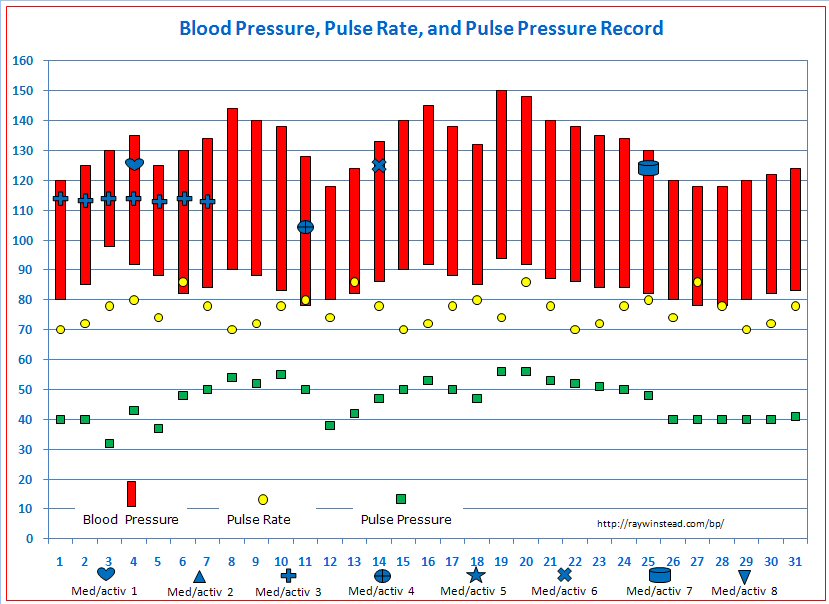
11. The "Extras" charts provide the
opportunity to add symbols representing different medications and/or activities
onto copies of the BP, PR, PP Graphs, i.e., a visual representation of these events
can be placed on the graphs themselves. Note the example above.
a) Choose
whether you want to use the color "Extras" graph or the black and white "Extras"
graph, since each chart must be modified separately.
b) To place a
particular symbol onto the graph, first select the symbol you want at the bottom
of the chart by RIGHT clicking on it. (Be careful not to click on the text
box below the symbol. If you do select the text box by mistake, just click
elsewhere on the page and start over.) RIGHT clicking on the symbol will
bring up a long menu that includes "Cut," "Copy," and "Paste" at the top.
Click on "Copy." (If a small menu with "Move Here" and "Copy Here"
appears, then ignore this menu and RIGHT click there a second time, and this
will bring up the longer menu you need.)
c) Move the
cursor, which will now have a "modified plus sign" associated with it, to the
top of the chart to the left of the chart title. (If you try this part of the
process elsewhere, it is likely you will get some bizarre changes to the
original graph. If this happens, just click on the Undo arrow at the top
of the page.)
d) RIGHT
click and the "Cut, Copy, Paste" menu will appear. Click on "Paste" and
the selected symbol will appear in the top left corner of the graph.
e) Drag the
new symbol to where you want it onto the graph, e.g., onto the vertical blood
pressure icon for that date. See the example above.
f) You can
change the "Med/activ #" notation for that symbol at the bottom of the graph, if
you wish, to the actual name or abbreviation of the medication or the event,
e.g., an exercise activity. "Med/activ #" is inside a textbox under the symbol.
Click in the textbox and note that you will then be able to edit the text to
what you want.
12. A place is provided on the "Data Sheet" for time and additional notes for each day.
The original Legacy Version 1.0 website is still available.
That website provides graphs for one week, two weeks, three weeks, and a month, each also giving an option for one record a day or for two records a day. Those files are in Excel .xls format and can be opened using Microsoft Excel or the free OpenOffice.org spreadsheet "Calc." To download the free OpenOffice Suite go HERE. Initial attempts were made to convert the updated versions for one month into OpenOffice "Calc" format, but the symbols and formatting lost was substantial and has not been pursued further.
Definitions:
Vital Signs are used to measure the body’s basic functions. These measurements are taken to help assess the general physical health of a person, give clues to possible diseases, and show progress toward recovery (See Vital Signs). There are four main vital signs: blood pressure, body temperature, pulse (heart rate), and respiratory rate (breathing rate). (For example, see HERE and HERE.)
Blood Pressure is the force of the blood on the walls of the arteries, i.e., the force in the circulatory system that circulates the blood throughout the body. (For example, see HERE and HERE.) A normal blood pressure is about 120/80, where the top number is the systolic pressure and the bottom number is the diastolic pressure. The unit of measurement is in millimeters of mercury (mmHg). (For example, see HERE.)
Systolic Pressure is the maximum blood pressure when the heart contracts. (For example, see HERE.)
Diastolic Pressure is the minimum blood pressure when the heart is not contracting between beats. (For example, see HERE.)
Hypertension means high blood pressure. (For example, see HERE.)
Pulse Pressure is the difference between systolic pressure and diastolic pressure, e.g., if your systolic pressure is 120 and your diastolic pressure is 80, then the pulse pressure is 40. More recently, researchers are finding that pulse pressure may even be a better predictor of cardiovascular problems than hypertension. For example, see HERE. Dr. Vincent R. Moloney states that when pulse pressure is greater than 60 mm HG there is an increased incidence of adverse cardiovascular events, especially in the older population. Diastolic pressure is more predictive of possible cardiovascular problems in people less than 50 years old. At 50 - 59 years of age systolic pressure is most predictive, while after 60 the pulse pressure is most important. As one ages there is a gradual shift in the strength of prediction of risk from diastolic pressure to systolic pressure to pulse pressure. Also see HERE and HERE.
Pulse Rate (Heart Rate) is the number of times the heart beats in one minute. (See HERE and HERE.)
Body Temperature Normal: 98.6°F (37°C); greater than 100.4°F (38°C) is considered a fever. (See HERE and HERE.)
Respiratory Rate (Breathing Rate) A person’s respiratory rate is the number of breaths you take per minute. The normal respiration rate for an adult at rest is 12 to 20 breaths per minute. (See HERE and HERE.)
Lifestyle Recommendations for Long Term Health by Dr. Andrew C. Browe
Also check out Dr. Winstead's little Statistics Handbooklet:

The Intuitive Statististics Handbooklet
of Standard Deviation, Variance, et Cetera
Ray L. Winstead, Author
Back to Dr. Winstead's Homepage
| Current Percentage Metric Time is |
|
O'Clock |
*
All Vital Signs Tracking Websites
and spreadsheets © 2011-2026 Ray L. Winstead.
Downloads are free for personal use but may not be sold.
Be aware that U.S. federal laws, as well as international laws, give
copyright owners intellectual property rights. For example, if you own
copyrighted work, no one else can use your work without your permission as long
as you are alive, plus an additional 95 years. If you use copyrighted material or
images owned by a legal copyright owner, you will have to pay him
(me) civil damages. If you use someone else's copyrighted material and
commercially profit from that use, you will have to pay monetary damages, plus
any monetary gain, to the copyright owner (me - RLW) as
restitution.