The Intuitive Statistics Handbooklet

of Standard Deviation, Variance, et Cetera

Simple Explanations of the Measures of Variation and Their Associated Concepts,
Plus a Practical Exercise to Illustrate the Concepts

Ray L. Winstead
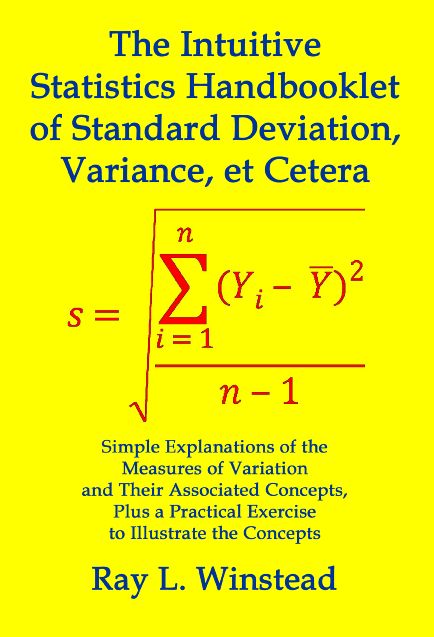


Order this 55-page handbooklet from Amazon.com
by clicking on either image of the cover of the book


Book Description

This 55-page "handbooklet" is intended for anyone at any level who wishes to have more intuitive explanations of the concepts of standard deviation and variance, as well as a better understanding of their formulas and associated concepts. (Total of 66 pages.)

Part 1 explains the concepts of standard deviation and variance as measures of variation.

Section I.1: Introduction and the Mean
Section I.2: Standard Deviation of a Population Characteristic
Section I.3: Standard Deviation of a Sample Characteristic
Section I.4: Variance

Part 2 explains some additional statistical concepts specifically associated with standard deviation and variance, such as degrees of freedom.

Section II.1: Unbiased and Biased Estimate
Section II.2: Degrees of Freedom
Section II.3: Distribution of Measurement Values
Section II.4: Point Estimate, Confidence Interval Estimate, and Standard Error of an Estimate
Section II.5: Independent Variable and Dependent Variable

Part 3 provides a practical exercise to demonstrate the concepts of standard deviation and variance, as well as simple statistical tests, such as the t-test and F-test, to compare the characteristics between two groups. Strength of Association Measures are also examined.

Section III.1: Introduction to the Exercise and Calculations to Obtain the Standard Deviation and Variance
Section III.2: Comparing Two Groups
Section III.3: Strength of Association Measure

Part 4 provides information about Research Procedure.

Section IV.1: Outline of Research Procedure
Section IV.2: Null Hypothesis and “p value”

In addition to the explanations of standard deviation, variance, and some other concepts directly associated with these measures of variation, additional statistical concepts are mentioned to lead and encourage the reader to further explore the details of those useful statistical tools that are beyond the scope of this little “handbooklet.”
 

Author’s Comment

You may have heard someone say “You can prove anything you want with statistics!”  However, this is not true, unless the audience is ignorant of how statistics works, or unless the audience is not given essential information showing the validity—or not—of important conditions and assumptions behind the statistical techniques involved.  In particular, you cannot be deceived, unless you do not know how statistics works!  Furthermore, statistics cannot actually prove a particular conclusion, such as a difference among different groups.  The best statistics can do for you is to tell you, within a formal, probabilistic framework, that an observed difference among samples is probably different—or not—from what would be expected to occur by chance if the samples came from different groups having the same characteristics.  Even though statistics does not give you a proof, statistics does provide friendly tools that give you conclusions based on real data and valid techniques, so that, overall, you can be reasonably confident about the final conclusions (while admitting the possibility of being wrong).  However, no matter how elegant the statistical analyses are, the conclusions of the research may still be false, unless the data collected are valid representations of the real world and all the components of the study are properly designed and carried out. 


About the Author

Ray L. Winstead has a bachelor’s degree in mathematics (with an additional concentration beyond a minor in biology) from Atlantic Christian College (now Barton College in Wilson, North Carolina), a master’s degree in mathematics (with a minor in applied mathematics) from Duke University (Durham, North Carolina), and a Ph.D. in Zoology (with a minor in ecology) from North Carolina State University (Raleigh, North Carolina).  He was also a Postdoctoral Fellow for two years in biomathematics and statistics at North Carolina State University.  He was a Professor of Biology at Indiana University of Pennsylvania in Indiana, Pennsylvania, where he taught graduate courses in biostatistics and ornithology, as well as undergraduate courses in general biology and ornithology.  He retired in June 2013 from IUP after teaching there for thirty-seven years.  He is the editor of the book Our First Sixteen Presidents: 110 Portraits, Paintings, and Lithographs with Biographical Narratives by Franklin P. Rice (1882) and Henry W. Rugg (1888) published in January 2014 and also the editor of the book The Development of Law Pertaining to Desegregation of Public Schools in North Carolina: Circumvention of the Supreme Court’s 1954 Brown v. Board of Education Ruling for Ten Years in North Carolina (1966 dissertation) by Elton D. “E. D.” Winstead published in September 2014.


Order this 55-page handbooklet from Amazon.com
by clicking on either image of the cover of the book


 WinsteadBooks.com

Back to Dr. Winstead's Front Page