Download
Blood Pressure Tracker Form For Your Own Data Entry:
Download this file for Microsoft
Excel
Download this file for OpenOffice.org
Calc
Download This Example:
Download this file for Microsoft
Excel
Download this file for
OpenOffice.org Calc
(Downloads are free for personal use but may not be sold.)
Instructions for Entering and displaying your own blood
pressure and pulse rate (heart rate) tracking data:
(Also see the additional suggestion by Laura Renfree
from London, England at the end of the instructions.)
These files are in Excel .xls format and can be opened using Microsoft Excel or the free OpenOffice.org spreadsheet "Calc."
To download the free OpenOffice
Suite go to
http://download.openoffice.org/.
1. Download and save the Blood Pressure Tracker Form from
the appropriate link above, depending upon whether you plan to use
Microsoft Excel or OpenOffice Calc. (Both
types of files are in .xls format but the files will work better if used as
listed above.)
(You are also encouraged to download the example.)
2. Open the appropriate, saved file in Microsoft Excel or OpenOffice.org Calc.
3. After taking your blood pressure fill in the Systolic Pressure and
Diastolic pressure values into the appropriate columns.
(The difference between the Systolic
Pressure and Diastolic Pressure will be calculated automatically.)
Also enter your pulse rate (heart rate) into the
appropriate column.
(You may simply leave out the pulse rate values to
omit them from the graphs.)
4. The associated graphs will automatically update themselves (and
automatically adjust their blood pressure scales, if necessary).
5. Display a graph by clicking on either the "BP Graph in Color" tab
or the "BP Graph in Black and White" tab at the bottom of
the
data entry page. (You may return to the data entry
page by clicking on the "BP Data Sheet" tab at the bottom of a page with
a graph.)
6. Save the file with a different name, e.g., bp-yourname-date.
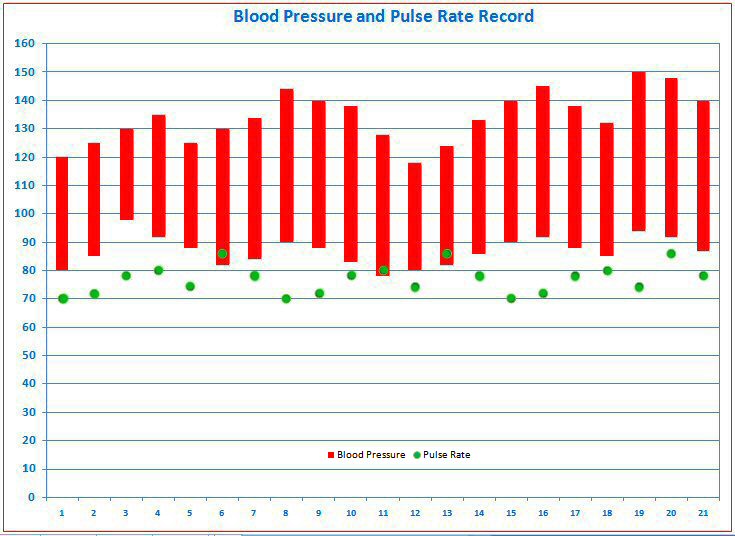
7. To change the graph title, e.g., to Blood Pressure and Pulse Rate Record -
Yourname -
date (e.g., 11/1-21/2008):
a) In Excel, click once on the title to select the title, then click again
on the title to be able to edit the title.
Edit the title and save.
(The title may be moved before or after editing by clicking and dragging the
title text box.)
b) In OpenOffice.org Calc, first
double-click anywhere on the graph, then double-click on the title to edit.
Edit the title and save.
(The title may be moved before or after editing by clicking and dragging the
title text box.)
8. The data set and graph may also be printed. The two different
graphs of the data are provided to account for the capabilities
of different printers.
9. As an additional feature in the One Month downloads, graphs of
Four-Day Running Averages for Blood Pressure values and
Pulse Rate are also provided .
(Note that in Excel 2007, but not in Excel 2003, the "BP Data Sheet" Tab may be
covered up
by the horizontal scroll bar on
the bottom right, so you may need to grab the left edge of the scroll bar and
move it to the right
to show the data sheet tab.)
Laura Renfree from London, England suggests
adding extra notes and comments about a person's activity associated with a
particular blood pressure reading or readings on the graph. Instructions
to add notes:
a) In Excel: Click on the chart. At the top of the screen click on Insert, then
click the
Text Box icon (looks like a page with a letter "A"). Position the cursor anywhere on the chart and draw a text box
at that location on the chart (hold down the left mouse button and drag). Then type in your note (e.g.,
BP after ten-mile run on the 20th). (The text box may be moved to a
different location.)
b) In OpenOffice: Do NOT click on the chart. At the top of
the screen click on View, then Toolbars, then Drawing, which will display the
drawing tools at the bottom of the screen. Then click on the Text Tool
(looks like a T). Position the cursor anywhere on the chart and draw a
text box at that location on the chart (hold down the left mouse button and
drag). Then type in your note (e.g., BP after ten-mile run on the 20th).
(The text box may be moved to a different location.) OR Click on a cell below the chart. Simply Type your note
within that cell below the chart (e.g., BP after ten-mile run on the 20th).
|
Click to check out
FREE
|
Back to Blood Pressure Tracking Homepage
Back to Dr. Winstead's Homepage
| Current Percentage Metric Time is |
|
O'Clock |